Introducing “Insights” – Phenome’s State-of-the-Art Analysis Module
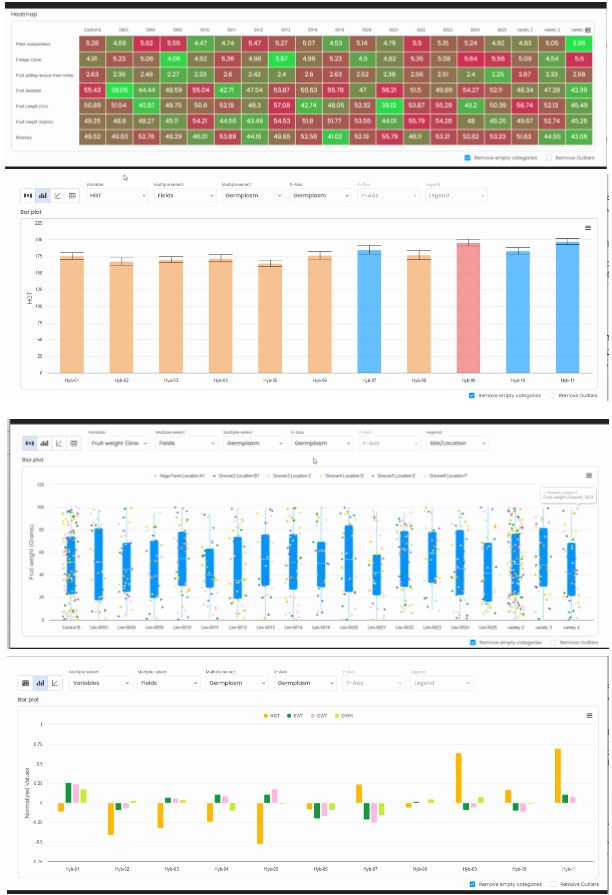
We’re thrilled to introduce “Insights,” our advanced analysis and data visualization module, designed to extract valuable knowledge from data collected through our mobile app, PhenoTop, and our core software, PhenomOne. This module is specifically designed to compare germplasm (varieties) across a spectrum of environments or within replicated trials. The user can easily filter and compare between various programs, years, and locations. Results are displayed as interactive charts, supporting zoom-in and out, filtering and sorting, removing outliers, calculating significant differences, with an immediate response to user action.
With its capacity for swift, on-the-fly calculations, “Insights” delivers a diverse range of analyses accompanied by visually impressive charts. The user can analyze both individual traits and combinations of traits, identify significant differences, conduct ANOVA tests, assess the impact of the environment on various varieties, and more. These capabilities facilitate such decisions as determining which varieties to advance to the next stage and identifying the germplasm that best suits specific environments.
The Insights module now supports analysis at the plant level. Users can select plant records and perform detailed analyses, enabling deeper insights and more data evaluation.
Insights > Save View.
The “Save Views” feature in the Insights module allows users to store customized views, including the selected RG, fields, and all data chosen in stages 1 and 2. Additionally, any data visualizations, filters, and statistical settings configured by the user are preserved within the saved view.
This functionality enables the creation of tailored views, ensuring that relevant information is easily accessible .

Whether you’re exploring diverse environments or conducting trial replications, Phenome’s cutting-edge analysis module is poised to elevate your analytical endeavors with real-time calculations and a versatile array of analytical tools.
To delve deeper into the capabilities of this groundbreaking module, we invite you to schedule a demonstration and discover more about its functionalities.
Insights > New Release. July 2026
This release introduces the following major enhancements:
- A Multi-Trait interactive analysis with heatmap, Moving mean, and function creation
- Stability Analysis, including the Eberhart-Russell and GGE Biplot Dashboards
- A full ANOVA Dashboard with Tukey HSD testing
See Everything at Once: Multi-Trait interactive analysis.
Breeders and product development teams can now view Multi traits across multiple locations in a fully interactive table analysis.
- A clear matrix view integrated with all collective data from multiple fields in multiple locations
- A heatmap overlay that instantly highlights top and bottom performers
- Control germplasm comparison, to benchmark all entries against a chosen standard
- Flexible statistics display
- Instant re-ranking with a single click on any column

Understand Performance Across Environments: Stability Analysis
Some varieties perform brilliantly in one location and inconsistently in another. The new Stability Analysis module helps breeders understand why – and which varieties are reliably strong performers, wherever they’re grown.
- Eberhart-Russell Dashboard: models each variety’s response to environmental conditions, revealing whether it thrives in favorable environments or holds steady even in difficult ones
- GGE Biplot Dashboard: a visual, two-dimensional map of variety performance and environment interaction, highlighting the varieties that combine high performance with high stability
- Stability Table: a ranked summary classifying every variety as Stable, High-responsive, Below-average, or Moderate
The Stability Table ranks every variety by its bi and S²di values, with an instant Stable / High-responsive / Below-average / Moderate classification. The GGE Biplot maps genotype performance and GxE interaction together, making it easy to spot the varieties in the “Ideal Zone.”

Confirm What Matters: Single Trait ANOVA Dashboard
The new ANOVA Dashboard breaks down variation into its true sources – genetic differences, environmental effects, and their interaction – then follows up with Tukey HSD testing to group varieties by statistically meaningful differences.
- Clear F-statistics and p-values for every source of variation
- Built-in assumption checks (Bartlett’s, Levene, and Shapiro-Wilk tests) to confirm the model fits the data
- An intuitive chart showing variety rankings and letter groupings side by side


Better Data. Better Decisions.
With the Phenome Insights module, you can bring statistics together into one connected workflow – helping breeding teams move from raw trial data to confident, defensible decisions, faster than ever.